DeMON
  • Home
  • Meet the Team
  • Research
  • Research Publications
  • Publication pages
    • All publications
  • News
  • Contact

Research

We combine brain imaging, molecular data and computational modelling to understand how neurodegenerative diseases begin, spread and differ between people. Our work falls into four connected themes: PET, fMRI, omics and AI.

PET
tau patterns & progression
fMRI
brain networks
Omics
proteomics & single-cell
AI
machine learning
Software
open tools

PET

tau patterns & progression

Tau-PET imaging allows us to visualise where and how much tau pathology has accumulated in the brain. By applying disease progression models to this data, we can identify patterns of tau accumulation and understand how they develop over time.

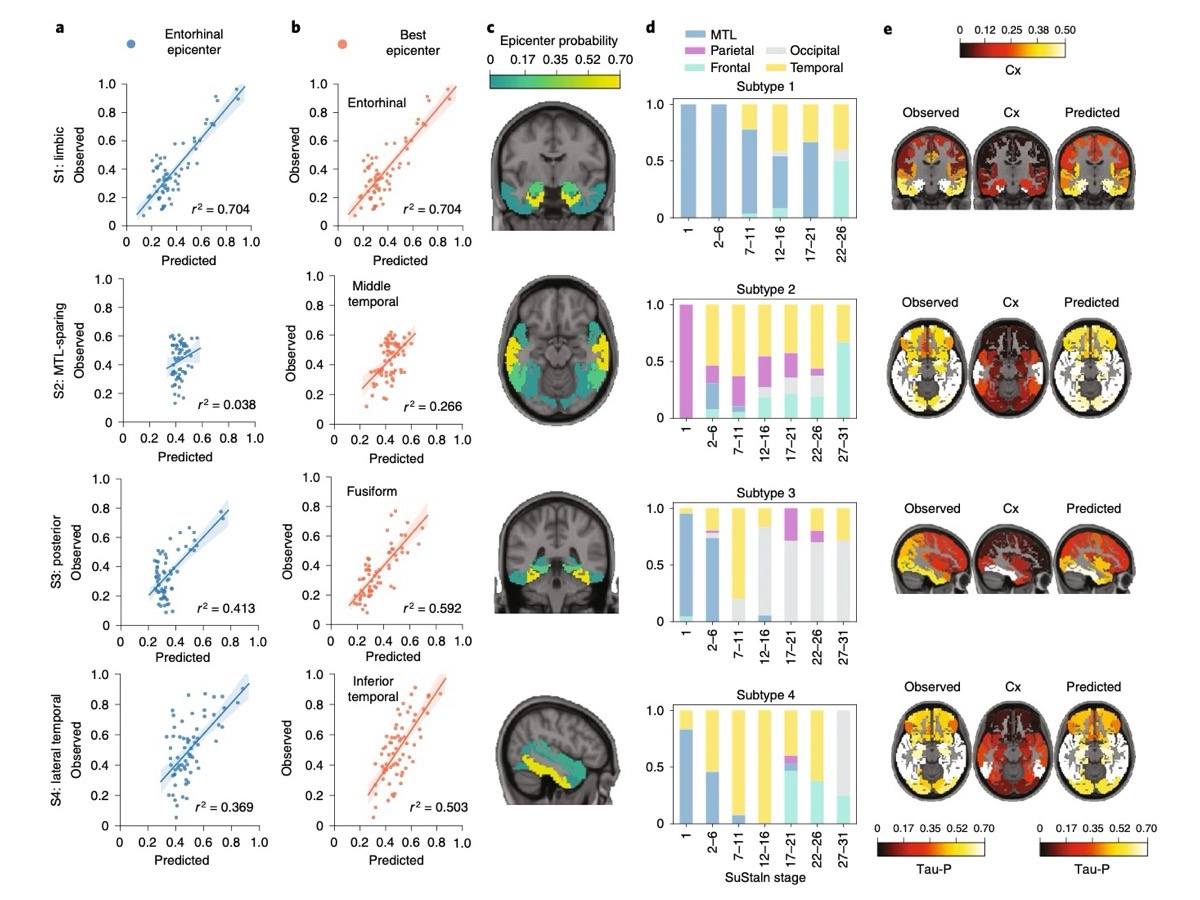
Our research has identified four distinct patterns of tau accumulation in Alzheimer's disease: limbic, MTL-sparing, posterior and lateral temporal. We are now working to characterise these patterns further, understand how they relate to brain connectivity and clinical symptoms, and investigate how they may help us better understand individual differences in disease progression.
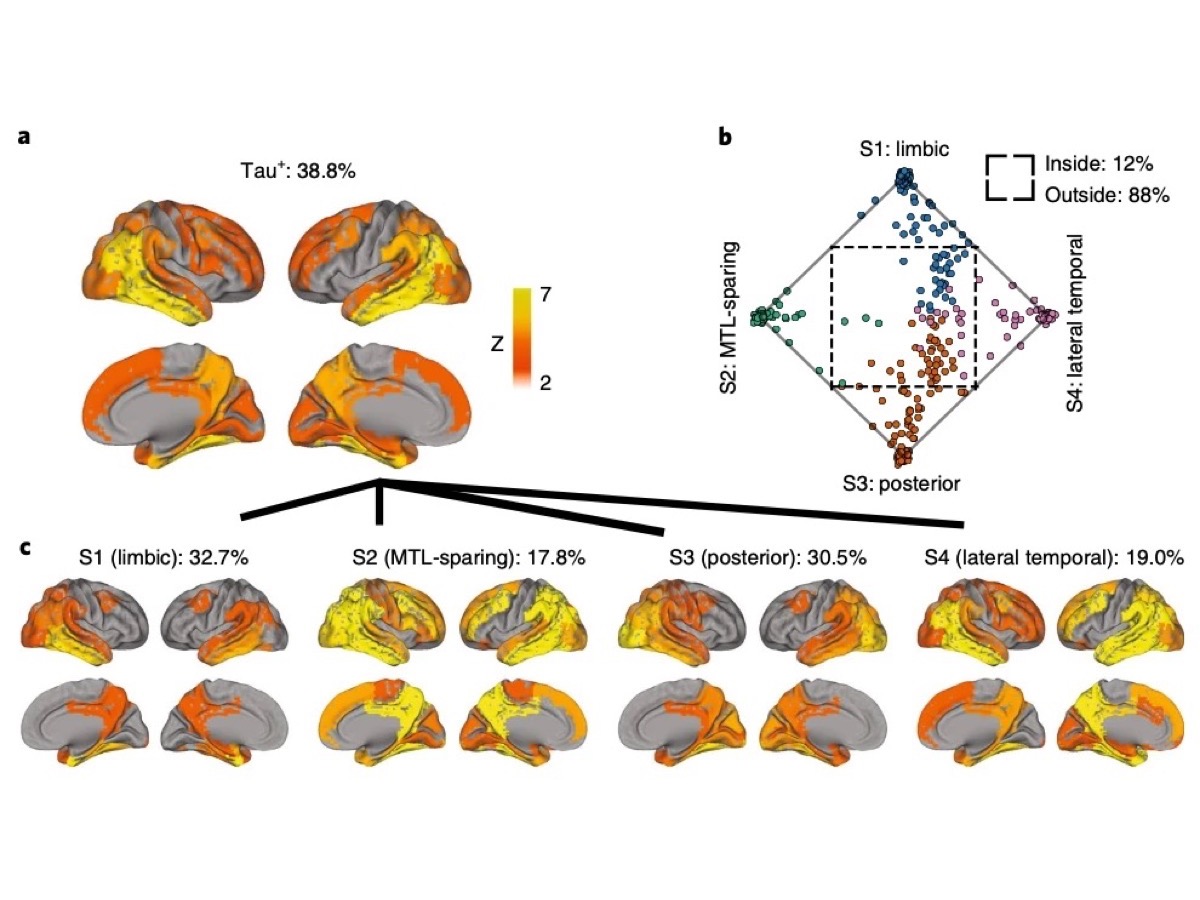
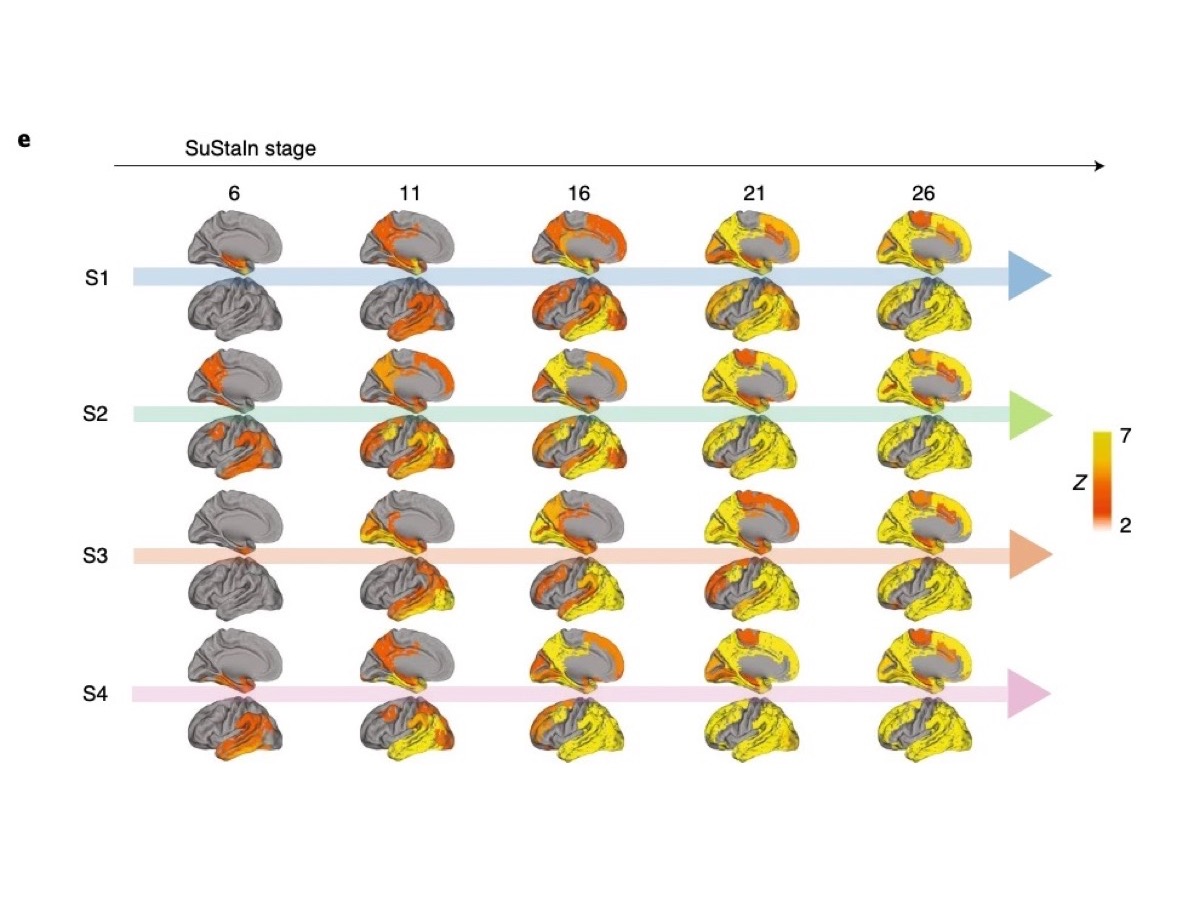
Brain maps of tau in the limbic, MTL-sparing, posterior and lateral temporal subtypes, with a plot of how individuals fall across the four subtypes Brain maps showing how tau builds up in each of the four subtypes across model stages Plots and brain maps comparing observed and predicted tau from epicenter regions in each subtype
Four tau subtypes
Figures adapted from this paper.

Four distinct trajectories of tau deposition identified in Alzheimer's disease Jacob Vogel et al. · Nature Medicine · Apr 29, 2021

Using tau-PET scans from 1,612 individuals, we identified four distinct trajectories of tau pathology: limbic, MTL-sparing, posterior and lateral temporal. These subtypes were stable over follow-up, replicated in a separate sample with a different radiotracer, and showed distinct demographic and cognitive profiles and outcomes, suggesting a re-examination of the idea of 'typical' Alzheimer's disease.

Read the paper
fMRI

brain networks

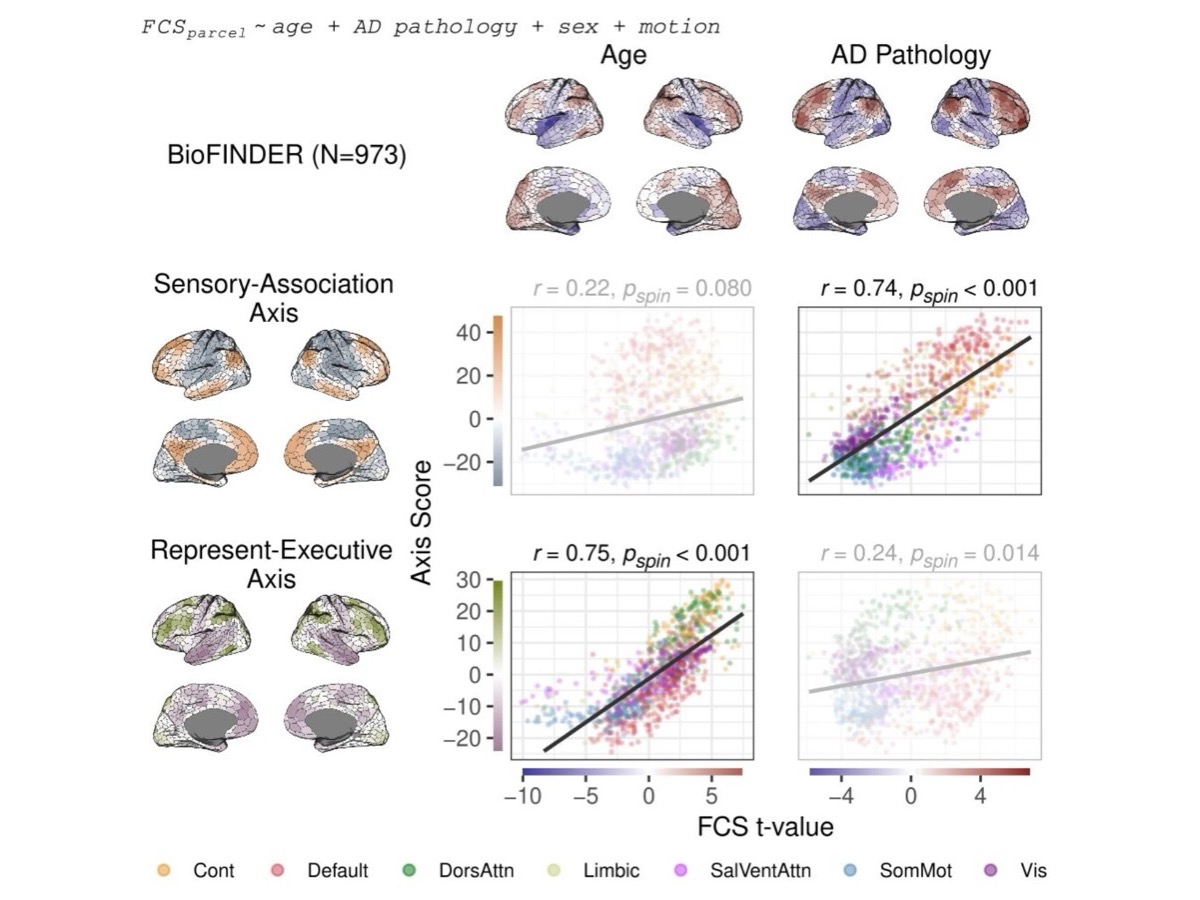
Functional MRI lets us measure how different brain regions communicate with each other. Using a whole-brain framework, we study how this communication is organised along several axes, and how ageing and Alzheimer's disease change it.

We also study how these changes relate to Alzheimer's pathology and to cognitive decline over time.

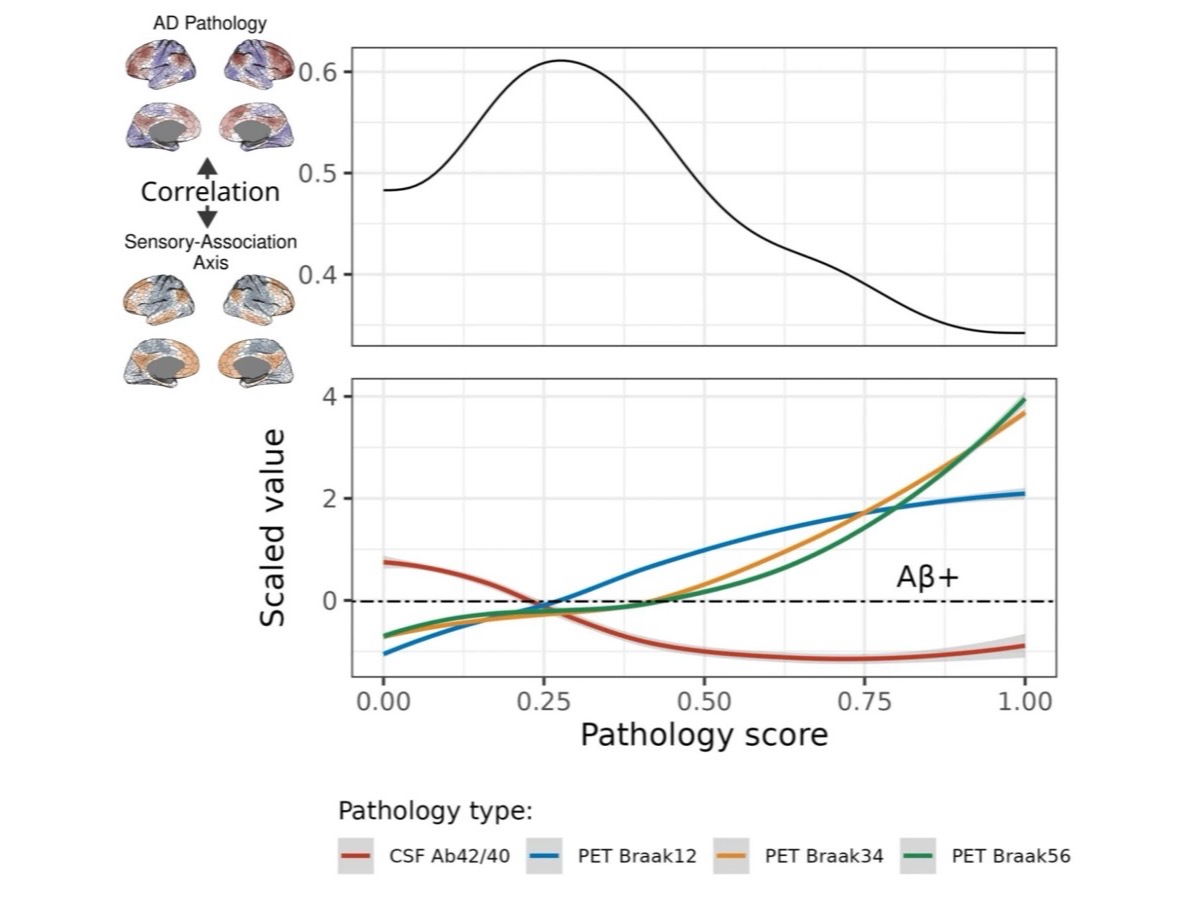
Brain maps and scatter plots relating age and AD pathology to the sensory-association and representation-executive axes Plots of the correlation with the sensory-association axis and of pathology measures across the pathology score
Age and AD along separate axes
Figures from this paper.

Different functional connectivity gradients reflect aging and Alzheimer's disease Jonathan Rittmo et al. · Nature Neuroscience · Oct 1, 2026

In two independent cohorts (BioFINDER-2, N = 973; ADNI, N = 129), functional connectivity changes linked to aging and to Alzheimer's disease aligned with separate axes of brain communication. Early AD pathology and later cognitive decline followed the sensory-association axis, while age-related change followed the representation-executive axis across the adult lifespan.

Read the paper

Omics

proteomics & single-cell

Omics methods measure thousands of molecules at once. We analyse brain tissue with single-nucleus RNA sequencing to see how each cell type responds to Alzheimer's disease, and whether these responses hold up in independent datasets.

We also work with proteins measured in spinal fluid and blood, with a focus on making biomarkers robust, accurate and easier to interpret.

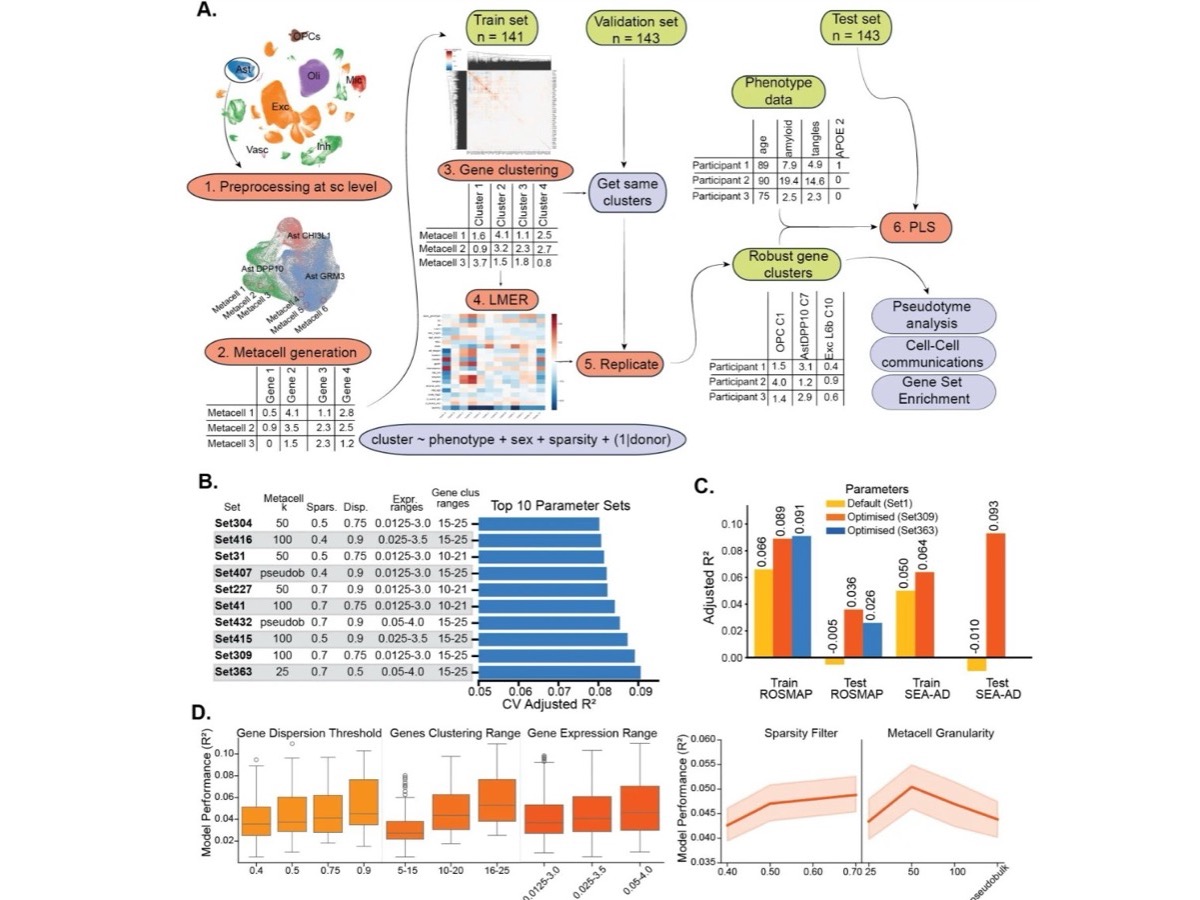
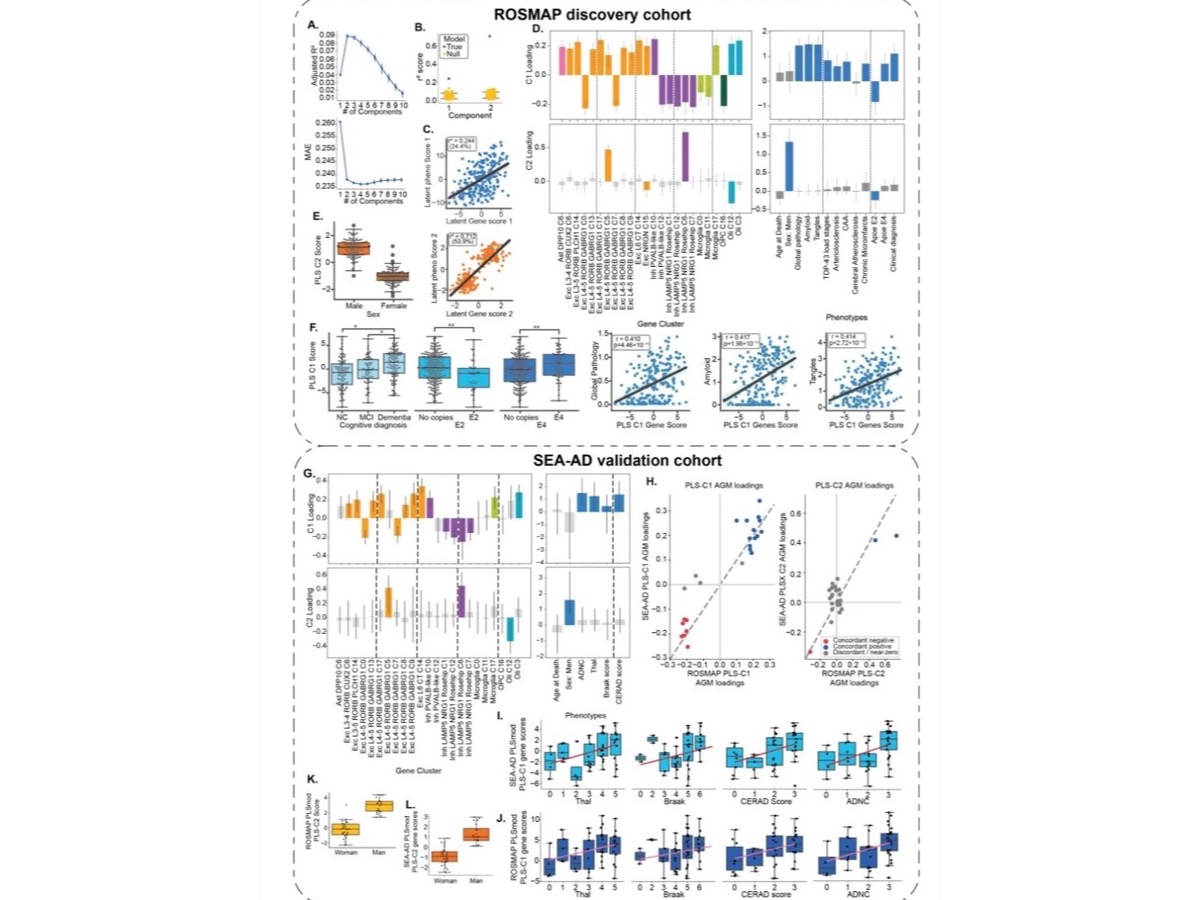
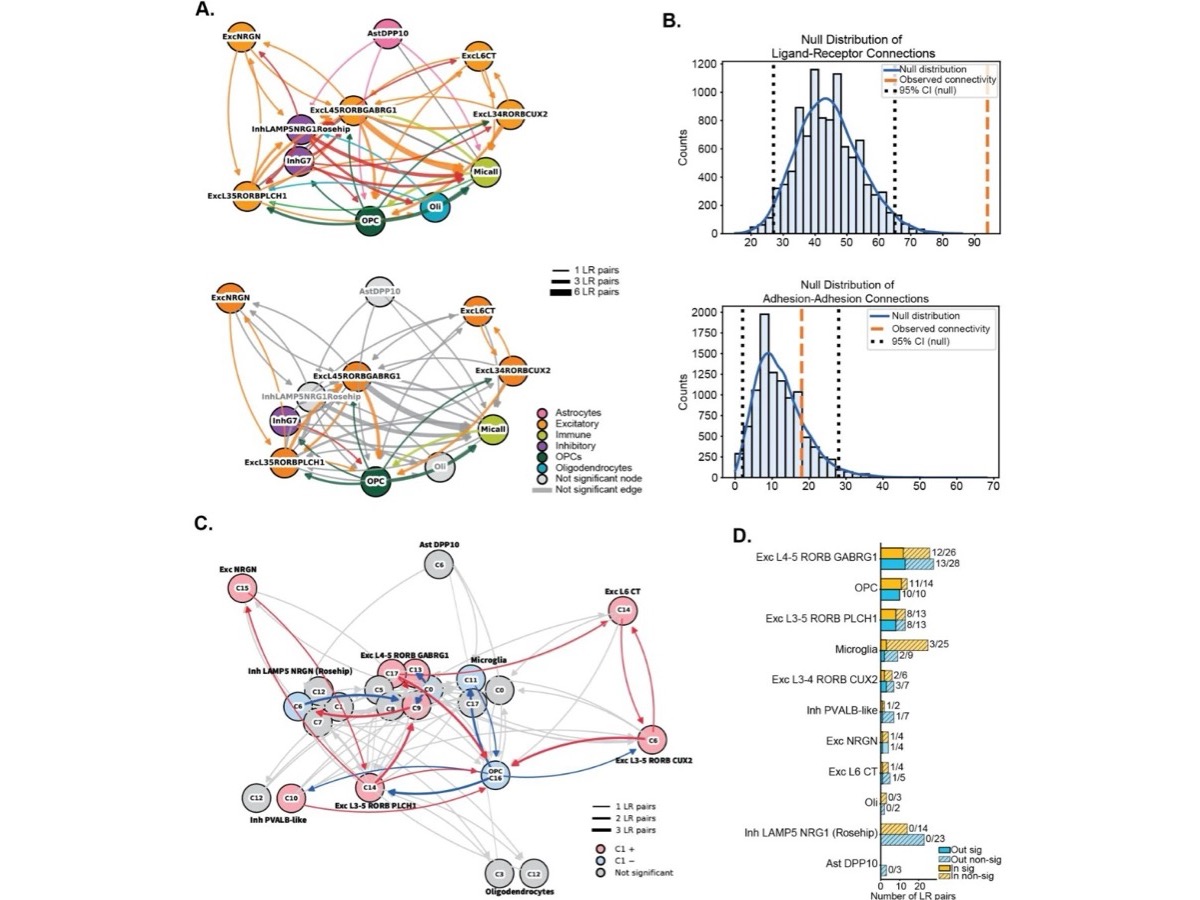
Overview of the analysis workflow, from single-cell data to robust gene clusters Results in the ROSMAP discovery cohort and the SEA-AD validation cohort Communication networks between brain cell types
Analysis workflow
Figures from this paper (CC BY-NC 4.0).

A coordinated and reproducible multicellular response to AD pathology Gabriele Vilkaite et al. · bioRxiv · Oct 23, 2026

Single-cell studies of the Alzheimer's brain often report differing results and rarely consider how cell types respond together. Across 2.3 million nuclei from 427 ROSMAP donors, we identified multicellular signatures of AD pathology and of sex, including profound changes in RORB-GABRG excitatory neurons and disrupted oligodendrocyte precursor signalling. These signatures predicted neuropathology and sex in a fully independent dataset (SEA-AD), giving a baseline against which perturbation and treatment experiments can be compared.

Read the paper

AI

machine learning

We use machine learning and deep learning to diagnose dementias from proteins, and to predict or even generate tau-PET scans from cheaper, more widely available data such as MRI and blood tests.

We also test how reliable these models are. We study how data leakage can make models look better than they really are, and build open tools to detect it (see Leakly and Plumber below).

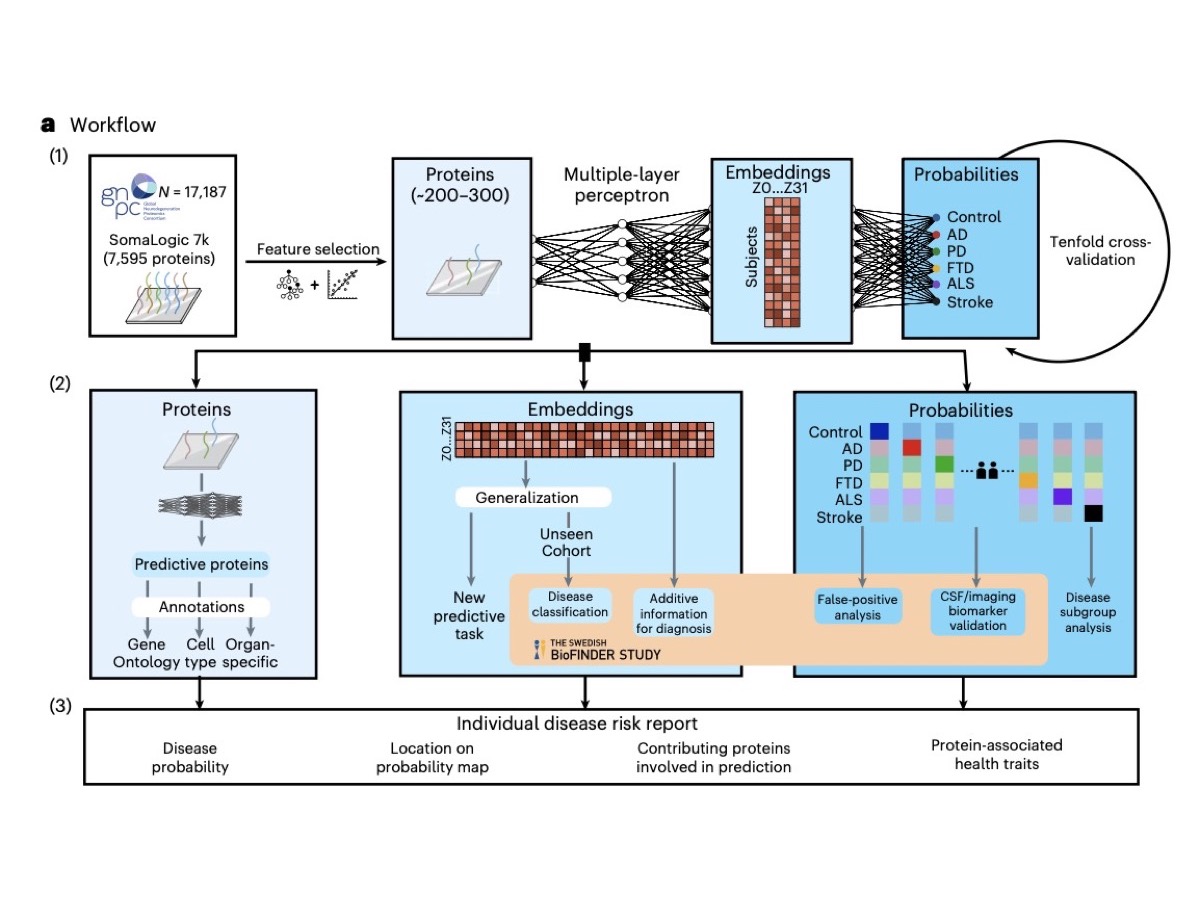
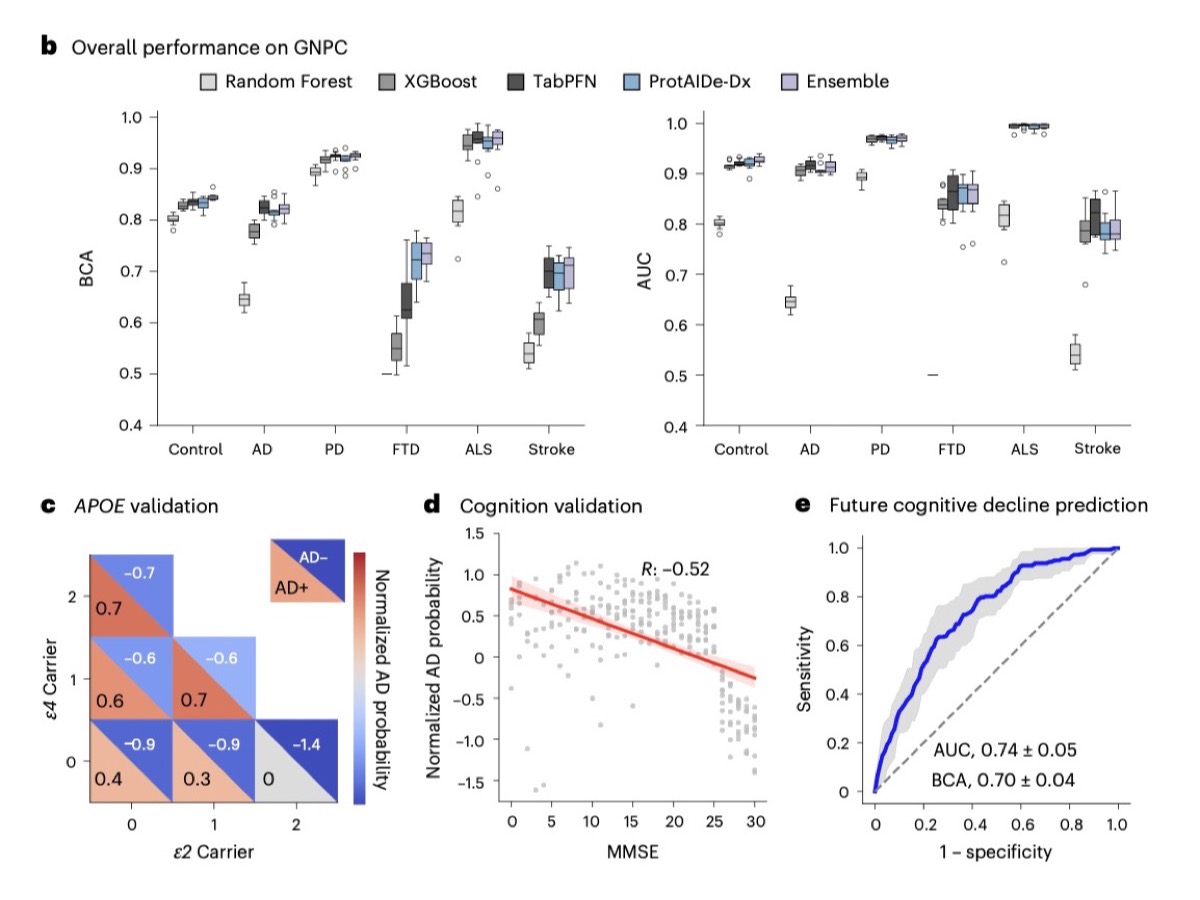
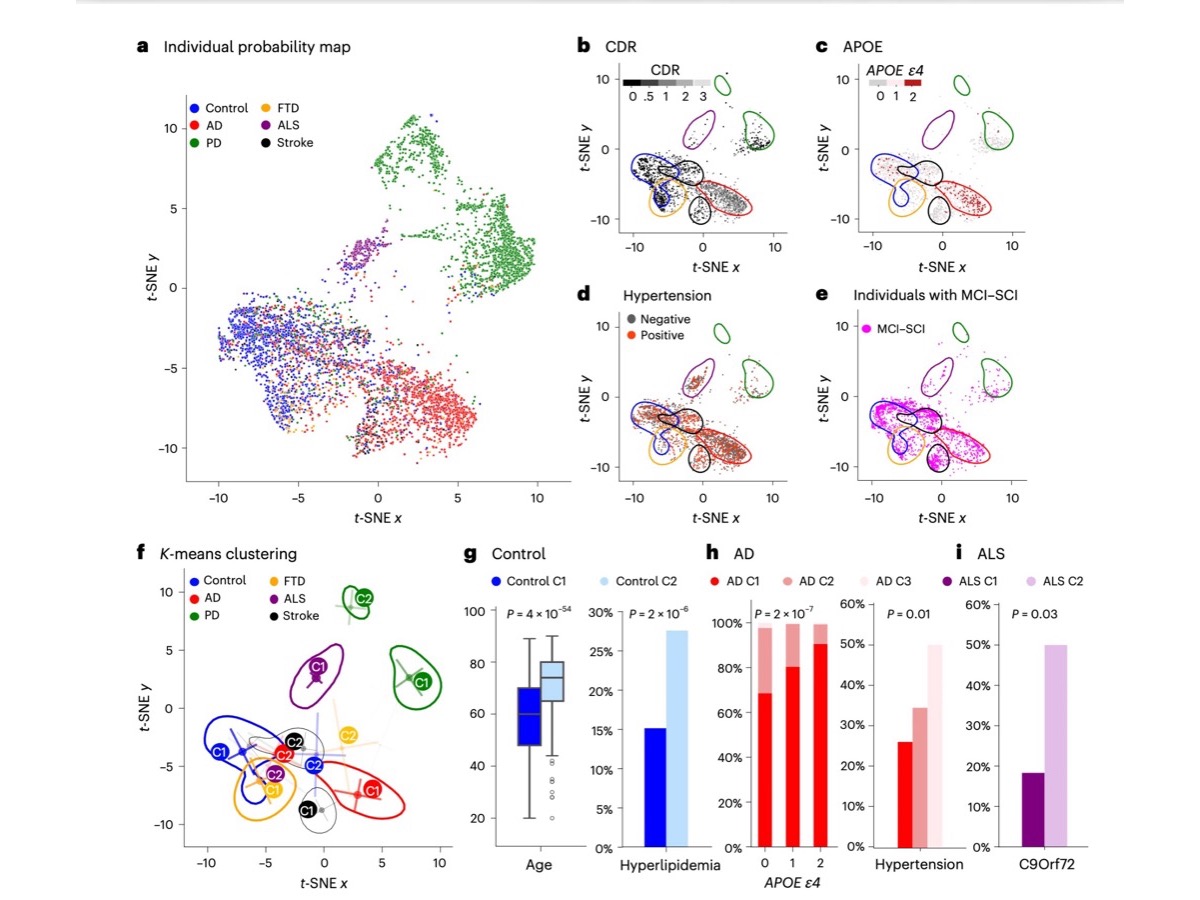
Workflow of the ProtAIDe-Dx model, from plasma proteins through a neural network to disease probabilities and an individual risk report Plots of diagnostic performance across conditions, with APOE, cognition and cognitive decline validation Maps of individuals by diagnostic probability, with clusters and subgroup characteristics
Model workflow
Figures adapted from this paper (CC BY 4.0).

A deep joint-learning proteomics model for diagnosis of six conditions associated with dementia Lijun An et al. · Nature Medicine · Mar 31, 2026

Mixed pathologies make dementia hard to diagnose, and scalable biomarkers are missing for most of them. We present ProtAIDe-Dx, a deep joint-learning model trained on 17,187 patients and controls that uses plasma proteomics to diagnose six conditions at once, with a balanced accuracy of 70-95%. It improved differential diagnosis in a memory clinic sample and shows which proteins drive each person's result, all from a single blood draw.

Read the paper

Software

open tools from the lab

Leakly

A Python package that checks machine-learning pipelines for data leakage. It uses label permutation to test whether a pipeline performs above chance when no true signal is present.

Get the package Source code

Plumber

A web tool for checking data leakage using large language models. Paste a method section, select the leakage checks, and it builds a structured review prompt to copy into an LLM.

Open the tool Source code
Icons from Bioicons. Brain slice by DBCLS and network by ChenxinLi, both CC BY 4.0; DNA, neural network and workflow icons, CC0.
See all publications on Google Scholar